Objectives
The
objectives are:
To quantify the chemically-induced ozone loss as a fonction of time
inside the Arctic vortex each winter.
Transport model method
Comparison between measurements and 3-D CTMs in which ozone is
considered as a passive tracer
This
page contains preliminary results for winter 2020/2021. Contact Dr.
Florence GOUTAIL for more details.
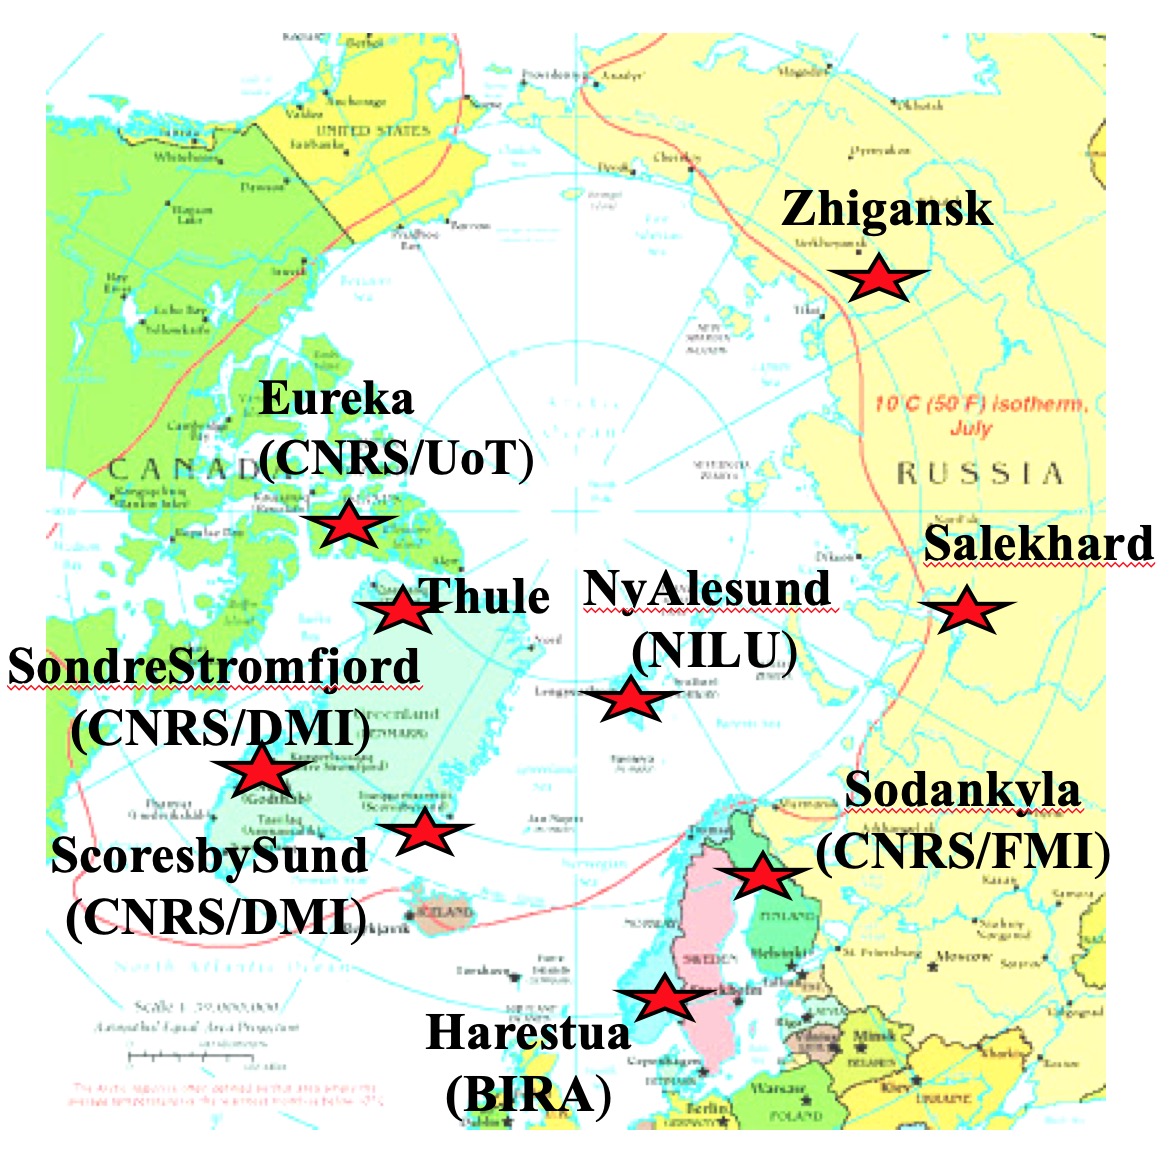
Measurements and Models
1.
Total ozone from the Ground-based UV-Visible SAOZ Spectrometers.
|
Station
|
Instrument |
Latitude |
Longitude |
PI |
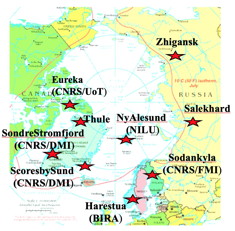 |
| 1 |
Eureka |
SAOZ |
80
N |
86
W |
CNRS/UoT |
| 2 |
Ny-Alesund |
SAOZ |
78 N |
12 E |
NILU |
| 3 |
Thule |
... |
76 N |
69 W |
DMI |
| 4 |
Scoresbysund |
SAOZ |
70 N |
22 W |
CNRS/DMI |
| 4 |
SondreStromfjord |
SAOZ |
67 N |
51 W |
CNRS/DMI |
| 5 |
Sodankyla |
SAOZ |
67 N |
27 E |
CNRS/FMI |
| 6 |
Zhigansk |
... |
67 N |
123 E |
CNRS
|
| 7 |
Salekhard |
... |
67 N |
67 E |
CNRS
|
| 8 |
Harestua |
UV-Visible |
60 N |
11 E |
IASB |
2.
Transport models
O3
loss in 2020/2021 - Preliminary
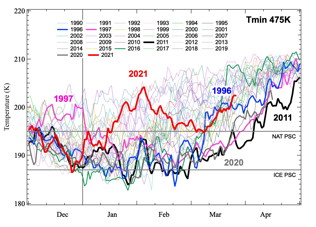
1.
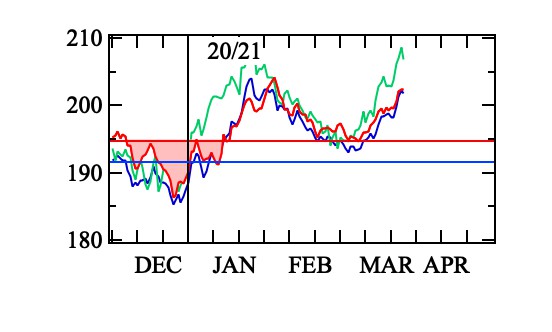
Minimum temperature at 475K (red), 550K
(blue), 675K (green)
- Temperature
below PSC formation (194 K) since early December
- Final warming on January 15.
- March 1st, temperatures
are decreasing for few days but above PSC Temp
|
|
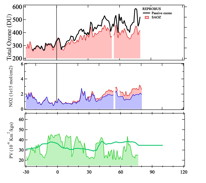
2.
Ozone above SAOZ station
Example: Sodankyla (Finland)
- An increasing difference between SAOZ O3 columns
(pink) and
passive REPROBUS
O3 (black) is observed up to January 15 .
-
Green: MIMOSA
potential vorticity when station inside polar vortex.
|
 |
|
|
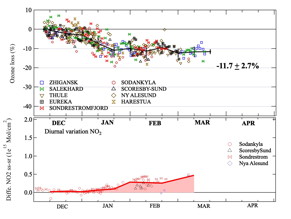
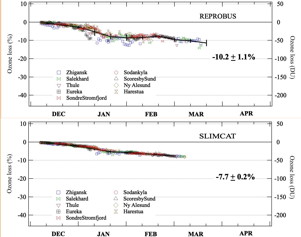
3. Cumulative ozone
loss above SAOZ using REPROBUS
- Top: ozone
loss
- -
Loss rate: 0.5%/day between January 1 and
January 20
- -
Cumulative Ozone loss on January 20: 10%
- -
Cumulative Ozone loss on March
10 : 11.7 % or ~ 50 DU
- Bottom:
Denitrification: difference between sunset and
sunrise NO2 column
|
| |
|
 |
|
|
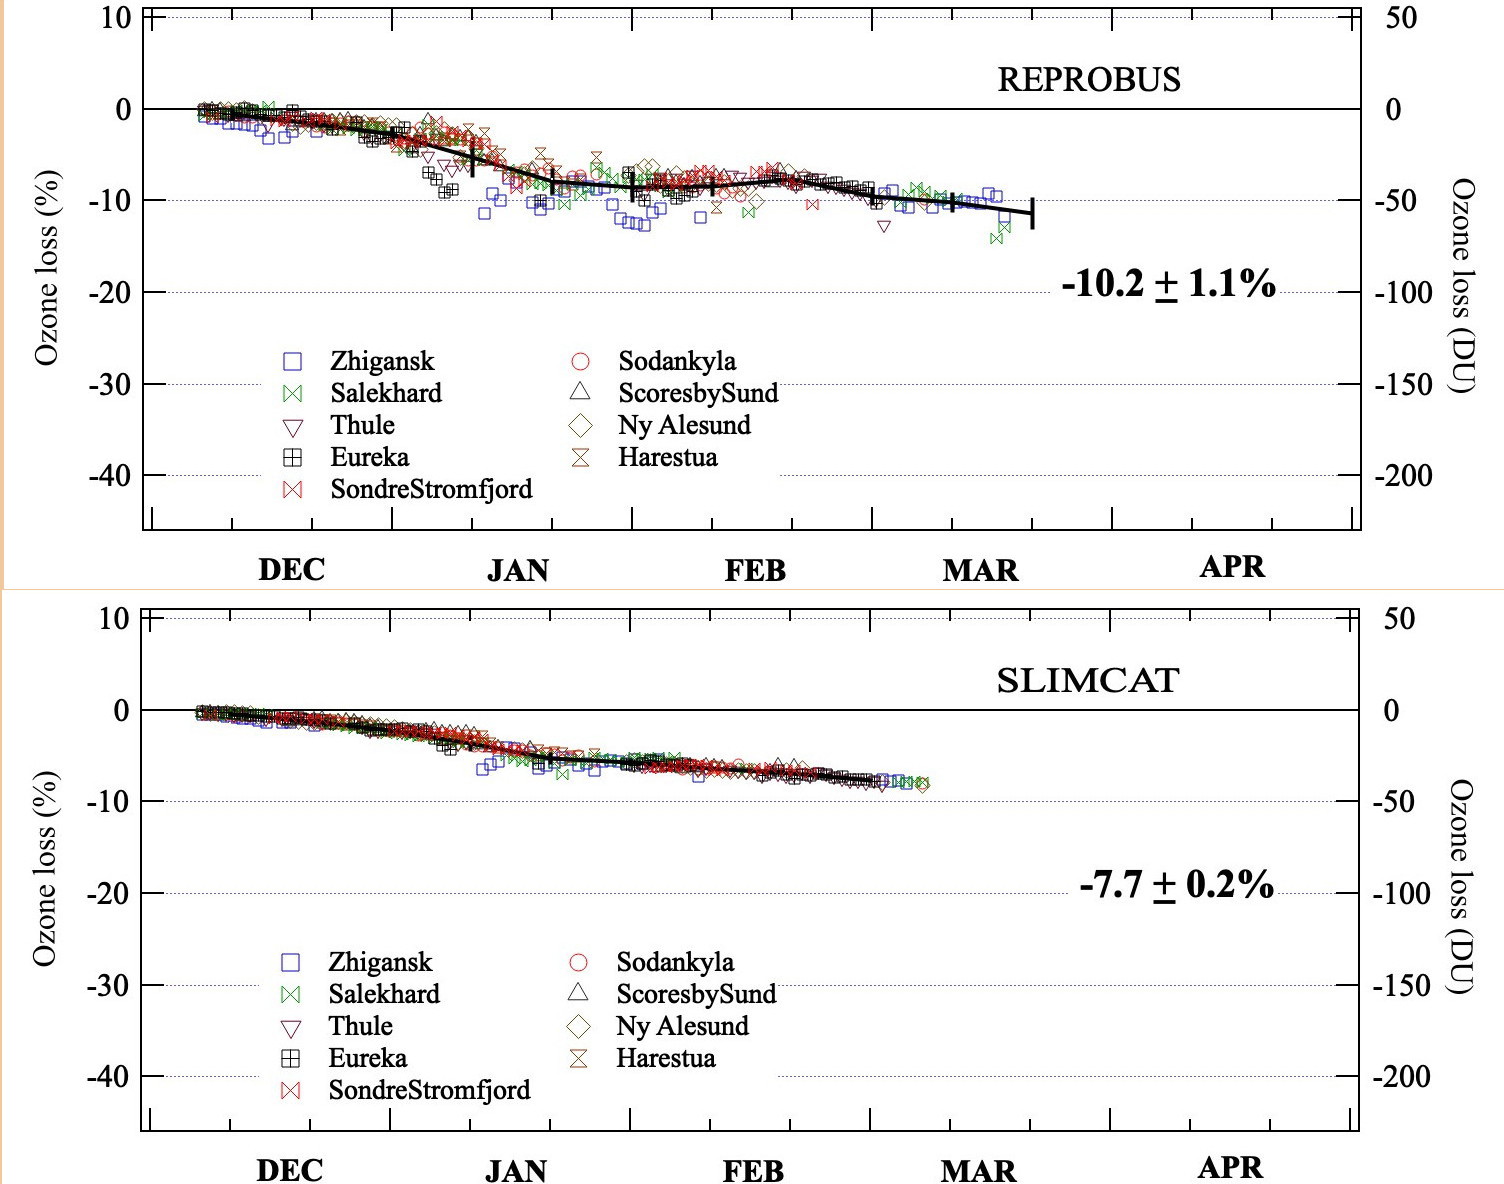
4. Cumulative ozone loss
above SAOZ stations from Models
REPROBUS : 10 %
SLIMCAT
: 8 %
|
 |
|
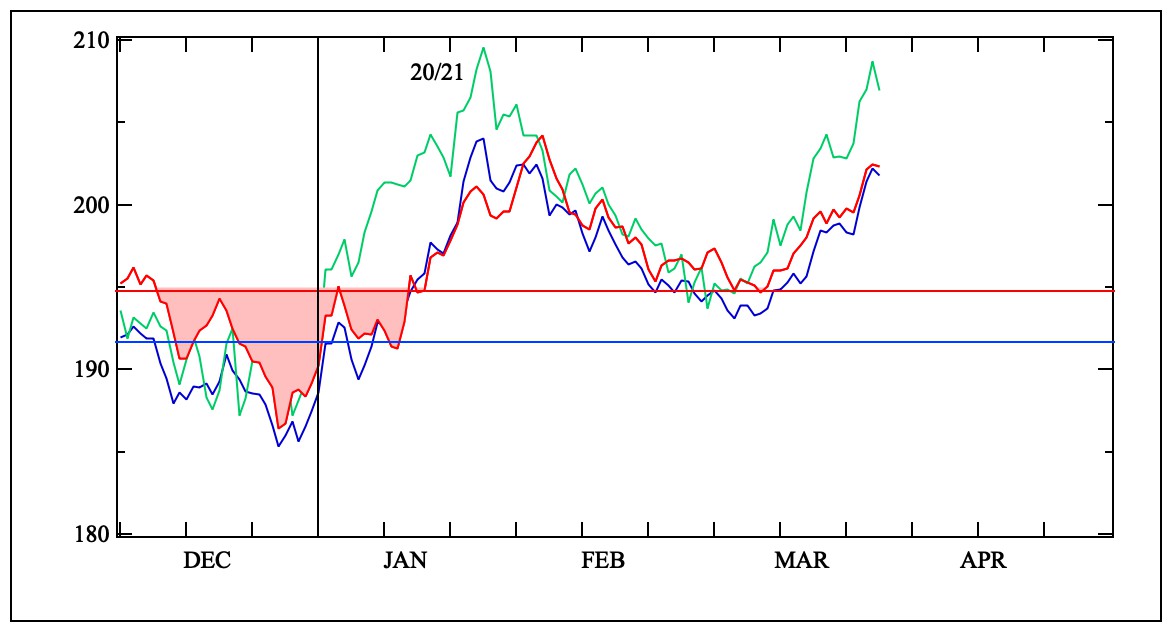
Comparison
to previous years
|
1
- ECMWF Temperatures
1996, 1997, 2011, 2016, 2020 are the coldest winter in 20
years
|
 |
|
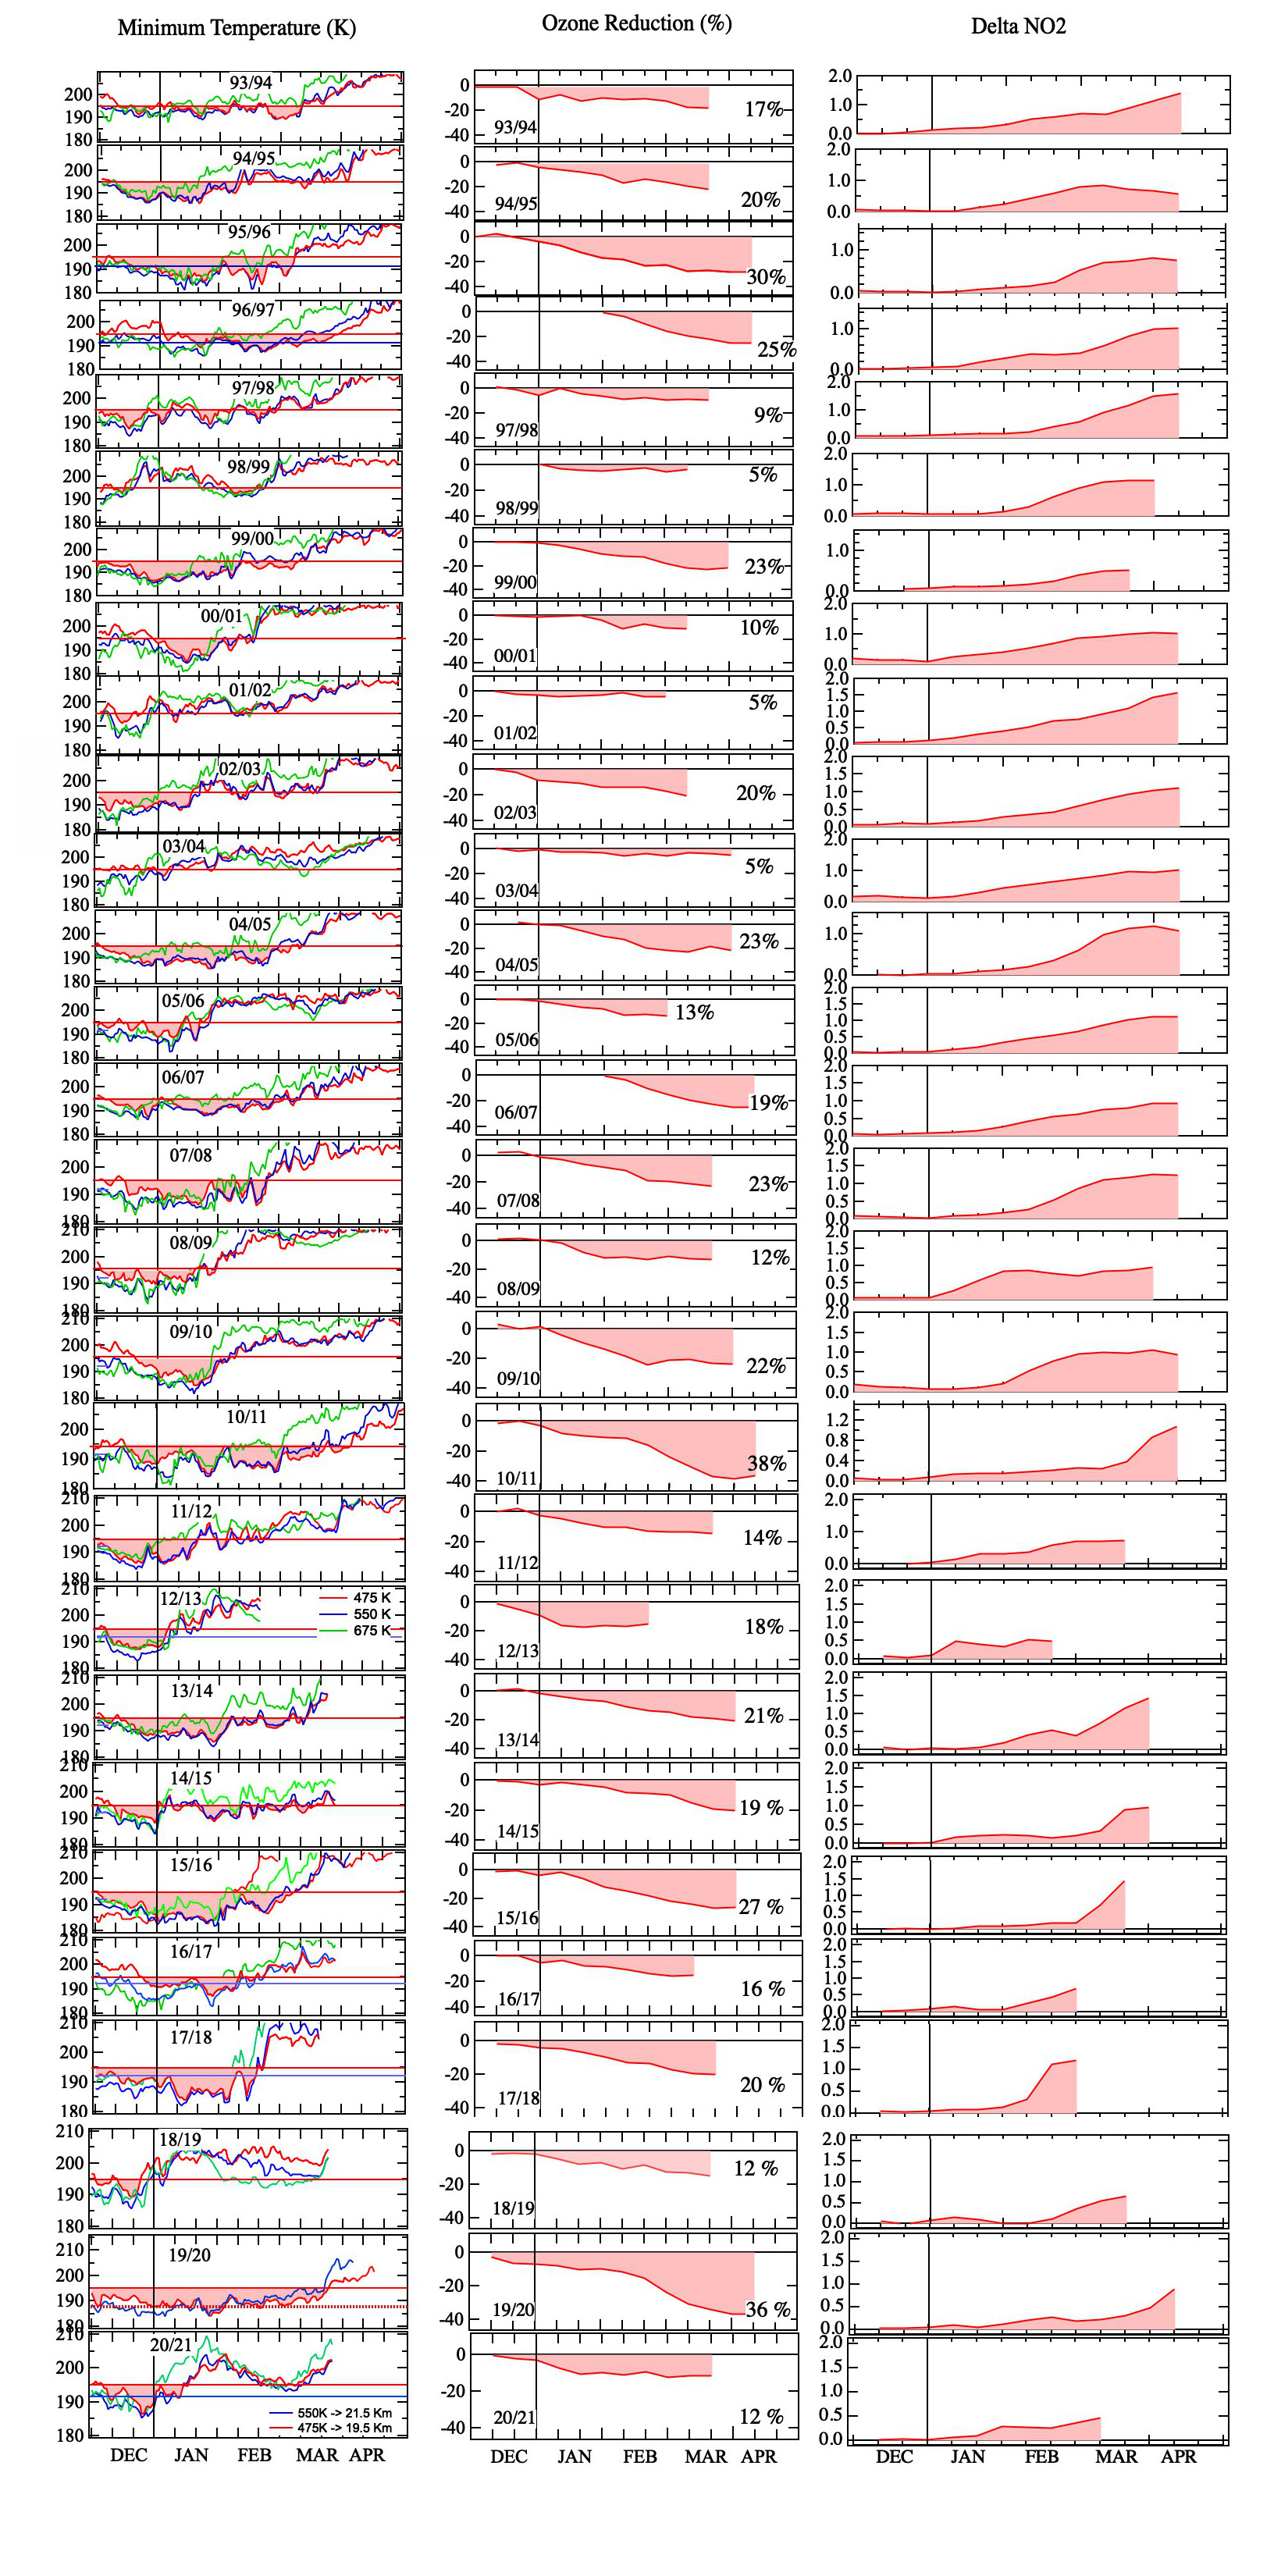
2
- Temperatures and O3 loss since 1994:
Left:
minimum ECMWF temperature at 475 K (red) and 550K (blue) north
of 30°N and limits for NAT PSC formation.
Middle: Total ozone reduction in the vortex from the SAOZ
network (shaded pink).
Right:
No2 diurnal variation increase = Chlorine deactivation
|
 |
|
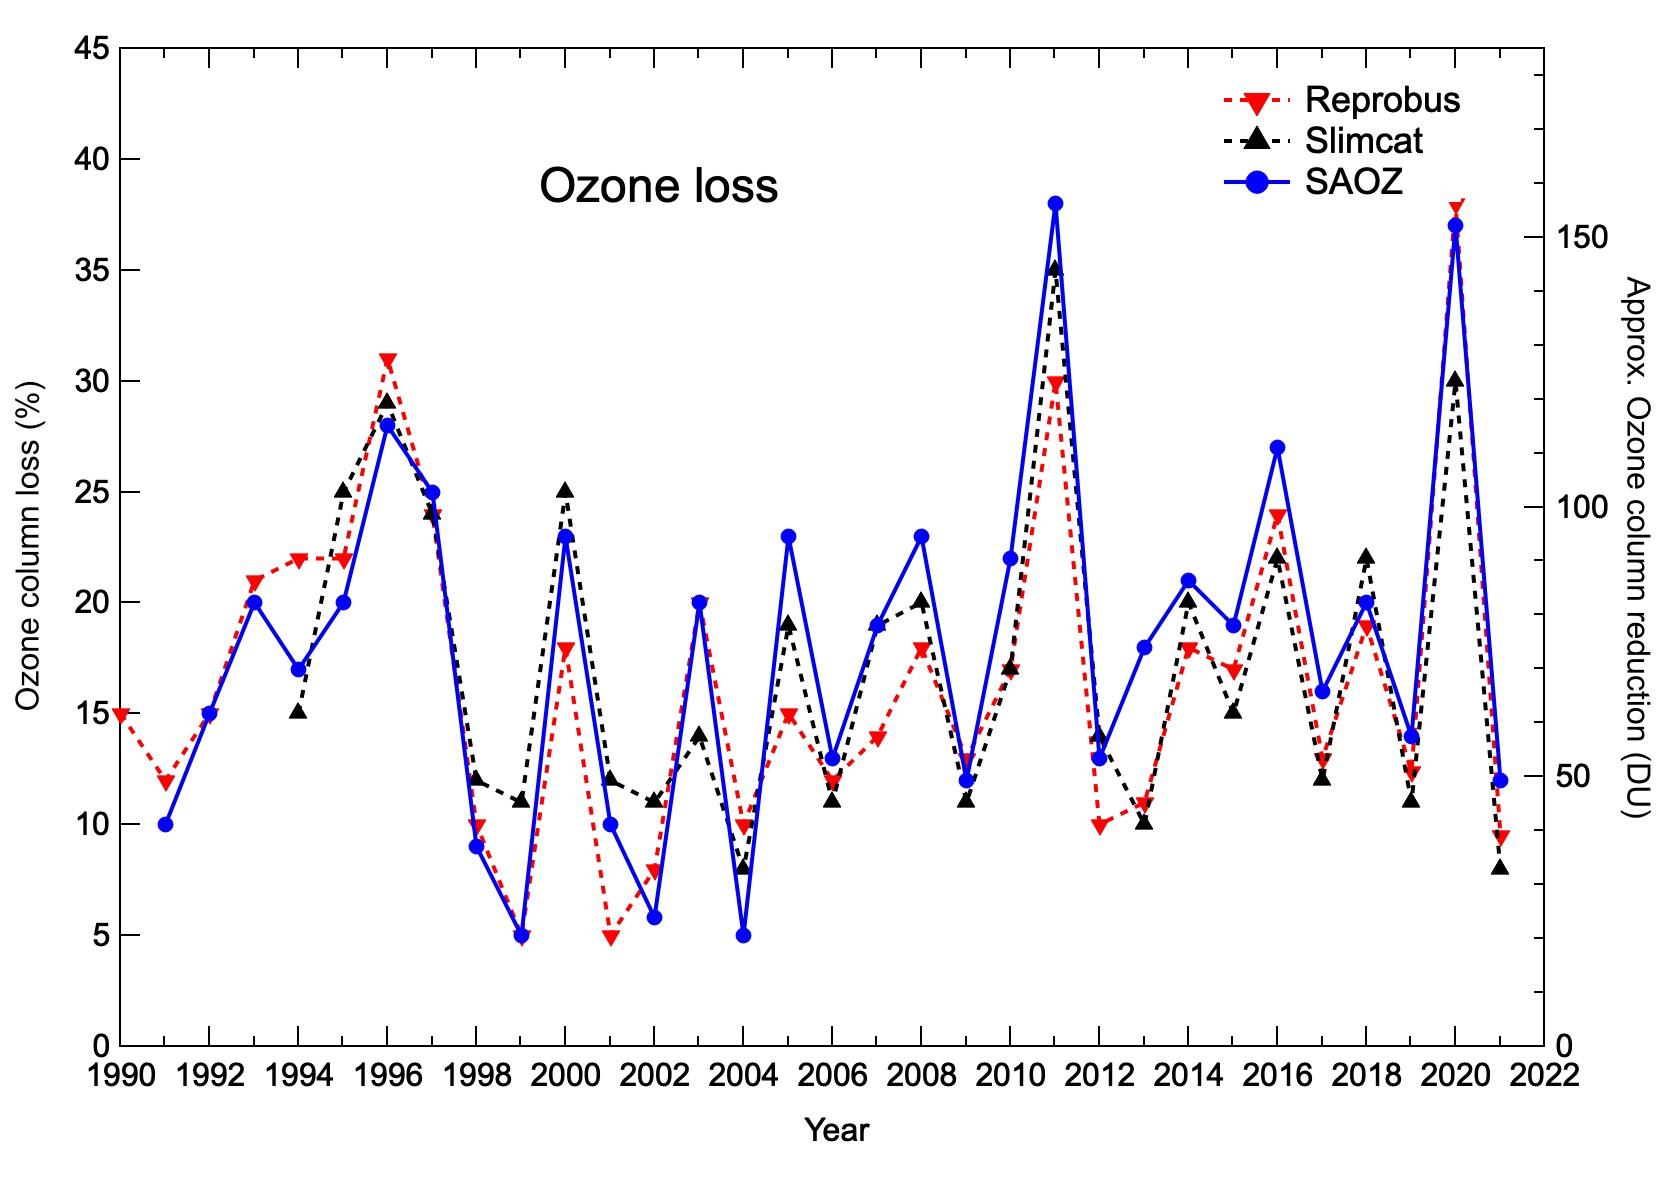
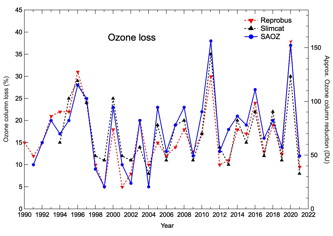
3
- Summary of yearly O3 loss since 1992
Comparison SAOZ and Models cumulative Ozone loss
|
 |
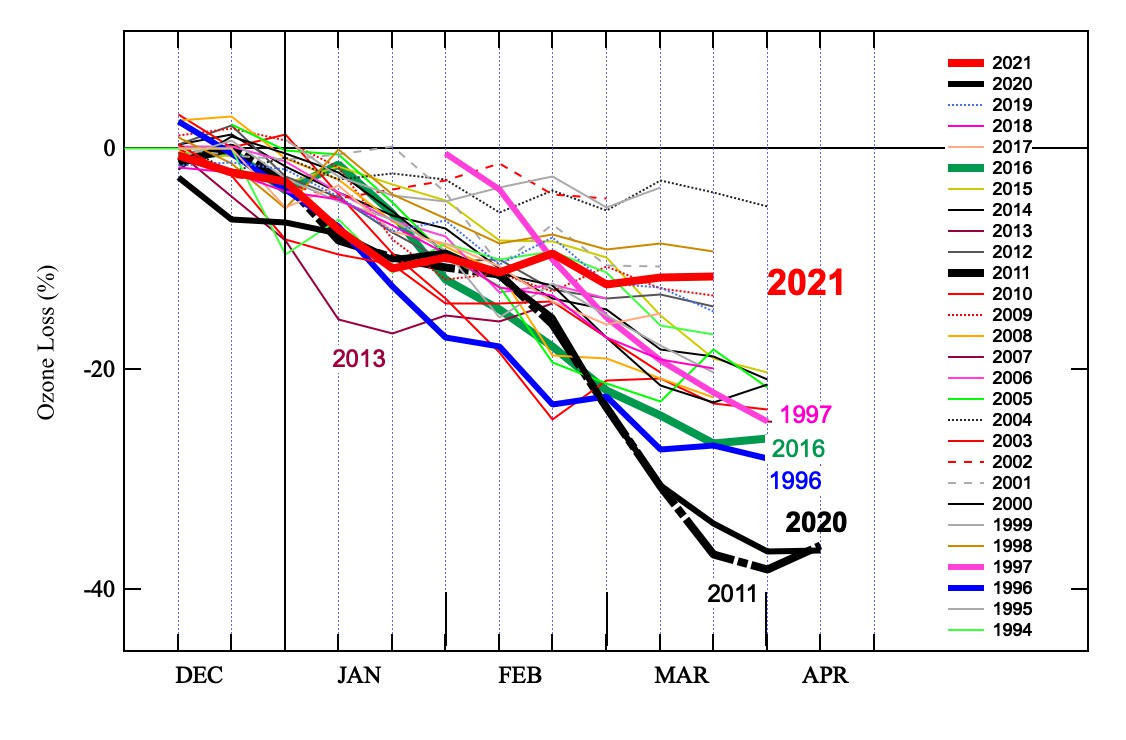
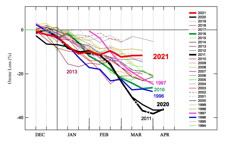
| 4
- Summary of yearly O3 loss evolution |
 |
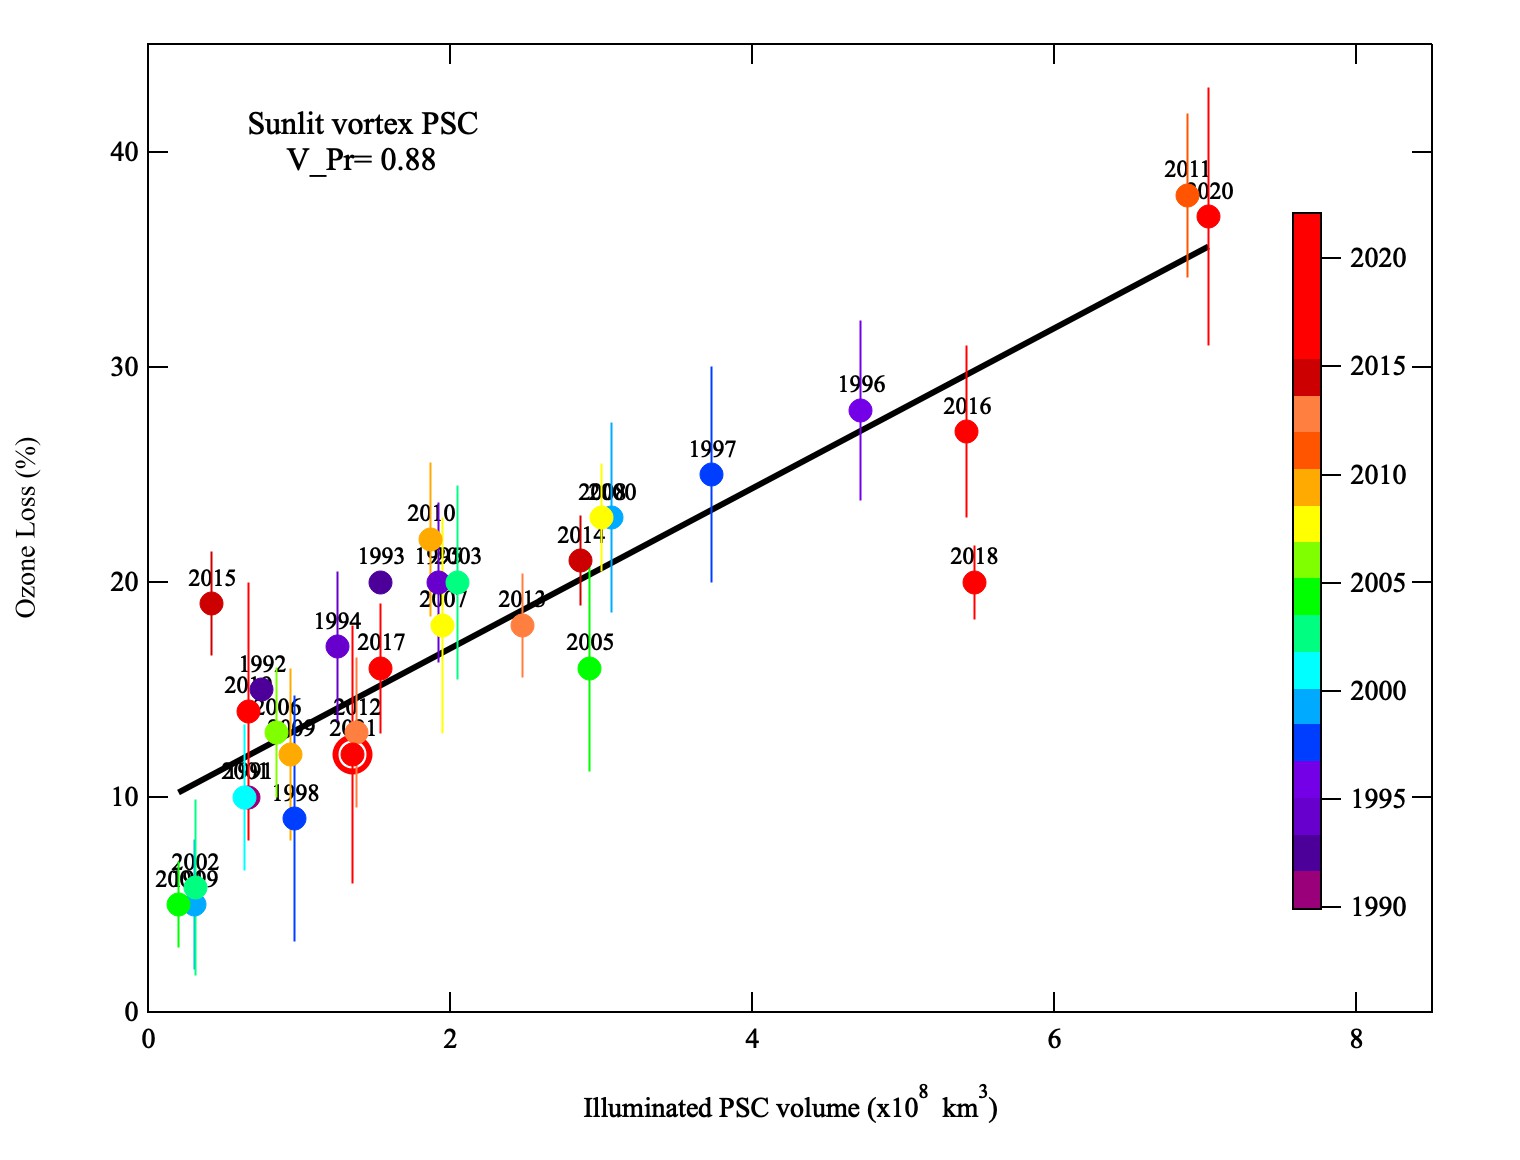
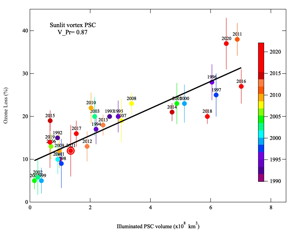
5
- Correlation O3loss vs Volume of sunlit PSC inside vortex
|
 |
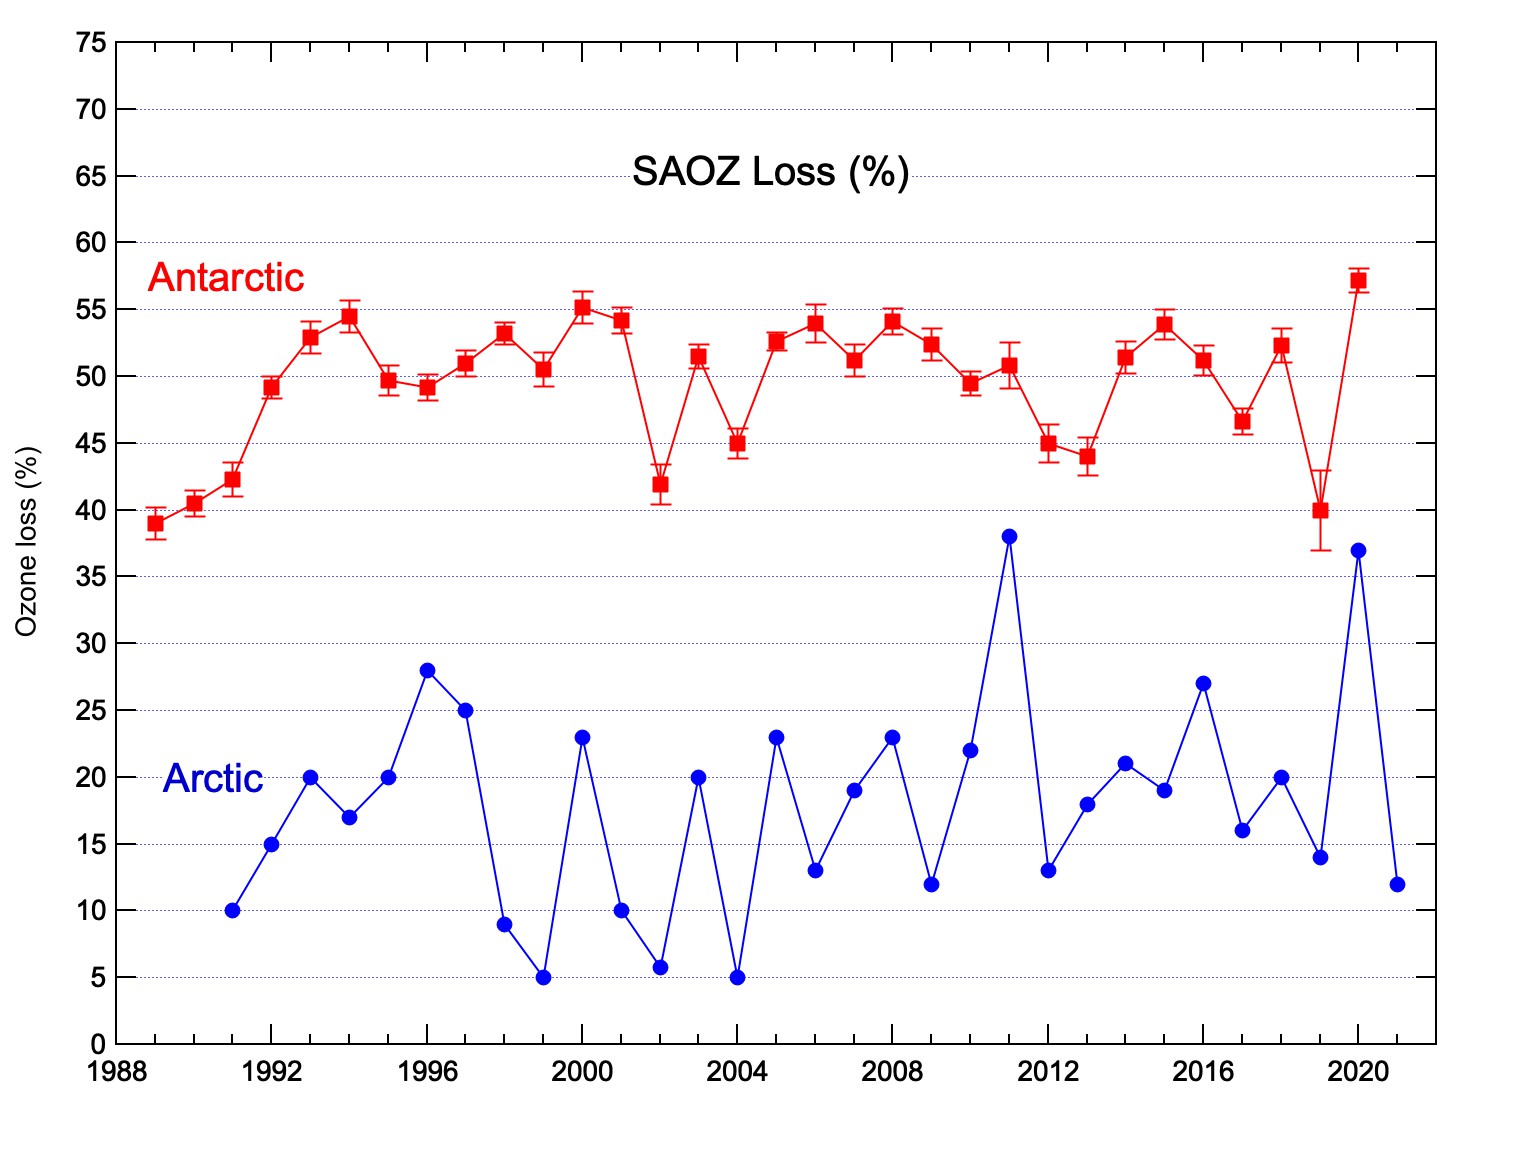
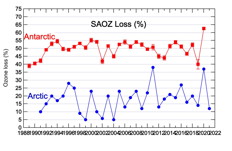
6
- Comparison with Antarctica
|
 |
For more information or any questions contact: Dr. Florence
Goutail:
florence.goutail@latmos.ipsl.fr